UV-Vis-NIR (Ultra Violet-Visible-Near Infrared) Spectroscopy allows to analyse the interaction between matter and electromagnetic radiation in the Ultraviolet, Visible and Near Infrared wavelength range. The spectral range of these instruments, depending on the model, can go from 200 nanometers (nm) of the C-Ultraviolet until 1100 nm of the Near Infrared and it’s quite broader than the visible region (400-700 nm) available by using the optical spectroscope. The theoretical principles, which will not been elaborated in this article, refer to the optical spectroscopy: every single material subjected to radiation reacts in a specific way by absorbing portions of such radiation. If these absorption bands are presented as a chart, they can provide an effective material identification method. Absorption and transmission are directly linked to the chemical composition and crystal structure of the gem. About the visible spectral range, when comparing directly observed spectra we are familiar with to the ones recorded by spectrophotometers, it is important to underline that the sensitivity of human is not constant for the whole visible range. The sensitivity of the human eye is at maximum at about 550 nm and gradually decreases towards both longer and shorter wavelength directions. This fact leads to reduced perception of the bands closer to the visible range ends, while the CCD sensors equipping the modern UV-Vis-NIR units perform in a far more efficient way.
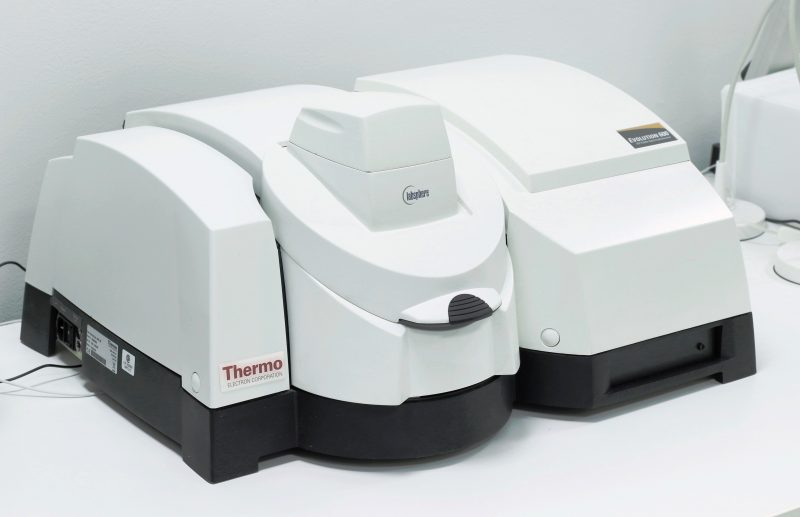
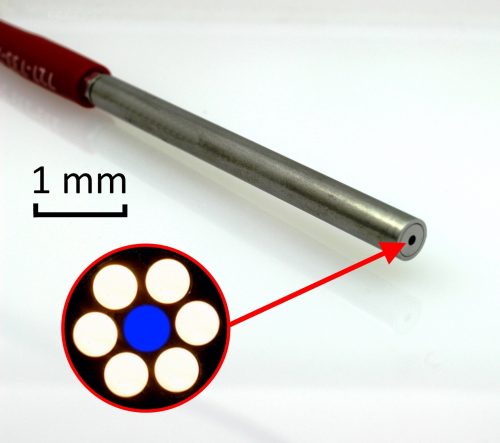
The UV-Vis-NIR spectrophotometers used in gemology can have basically two different sampling geometry setups. The first one results by the adoption of the classical units designed for the analysis of liquid samples contained in optic glass or quartz made cuvettes (Fig. 1). The gem is placed in the middle between the light source and the detector. The beam will be partially absorbed by the stone and only the transmitted part will reach the detector. A separate beam path ensures the reference spectrum of the source. Both beams are then compared by a computer based system and, as a final outcome, a chart featuring the resulting absorbance spectrum will be displayed on the monitor. Same as for optical spectroscopy, the orientation of anisotropic gems produces two different spectra due to absorption caused by ordinary and extraordinary rays. These two spectra are still specifically matching with the material but contain further information useful for gems studies. Dichroic gems may show very different general shape of spectrum depending on orientation too.Transparent gems are almost always fashioned in order to feature multiple internal reflections. While this is essentially the biggest man’s contribute to their beauty, it can became a problem when we want a beam to travel straight ahead through it in order to reach the spectrometer detector. For this reason, by using this setup, a specific care needs to be taken in sample positioning for getting good results. Originally designed to fit the needs of a wide array of scientific laboratories, these units feature a wide standardized-size chamber which allows the use of every sampling module available on the market. In gemology, as an example, it is not possible to test opaque gems by using the standard module designed for reading the resulting beam after the source passed through the stone: a specific module able to record the reflected light is needed. For some entry level spectrophotometers it is necessary to use a coaxial probe which is able to emit the source beam and collect the reflected emission at the same time. (Fig. 2)
The second sampling geometry used more and more often nowadays in gemological UV-Vis-NIR spectrophotometers is based on the integrating sphere concept (Fig. 3). Originally developed for colorimetric applications, the integrating sphere design implies the internally diffuse and uniform reflection of the light source. To ease this reflection pattern, a high-reflectance coating material is applied on the internal surface of the sphere. The shape and the coating of the sphere allows the light to bounce everywhere inside with an extremely low absorption, generating homogeneous radiation for illuminating the sample. The light will go through the stone from every possible angle allowing to overcome the issue connected with crystal orientation of anisotropic materials. Opaque material can be analyzed too: The sample needs to be positioned not in direct contact with the detector end, but allowing some distance in order to let it read the reflection from the sample only. Since this geometry allows sampling of transparent, translucent and opaque materials, it is very likely it will be the preferred one for future gemological-use designed units. Regardless from the sampling geometry, the scanning operation of UV-Vis-NIR spectrometers requires the spectrum of the light source to be scanned and recorded in the first place before inserting the sample. Subsequently the sample is analyzed and its spectrum recorded. The final automatic procedure compares the two scans and generates the absorption spectrum of the material.

Gemological applications
Comparing to the visual spectroscopy, the UV-Vis-NIR technique provides a larger number of information. Graphic visualization of the spectra allows to compare actual readings with a set of reference spectra samples collected in specific databases and thus facilitating its interpretation of the results.
Diamond
Diamond type differentiation based on nitrogen content is not a mere and useless theoretical exercise: on the contrary, it plays a very important and practical role nowadays. Starting from the assumption that all the colorless/near-to-colorless synthetic diamonds and the naturals suitable for HPHT color enhancement process belong to type II (in extremely rare cases to type IaB), it’s easy to realize the importance of being able to identify nitrogen content or aggregates; one above all, the N3 center. This lattice defect, generating an absorption band at 415.2 nm, is constituted by 3 nitrogen atoms bonded to a vacancy, and it’s detection is critical in diamond identification. 98% of all diamonds belongs to the well-known “cape series” featuring this absorption band as a common characteristic. As a logic deduction, if we are analyzing a colorless/near-to-colorless diamond featuring the N3 center in its absorption spectra, we are safely confident that diamond is natural and not HPHT-treated. Since the N3 center is located in the visible range, someone could challenge the choice of using an expensive spectrometer device for doing the job a common optical spectroscope would be enough for. The problem comes either from the relative weakness that sometimes this center exhibits and from the reduced human eye efficiency for radiation occurring close to the boundary of visible range. All in all, only an effective spectrophotometric unit can absolutely detect the presence of such center and, thus, give an indicator that further examination is needed. Among other potentially critical indicators in the analysis of diamonds we may include: the N9 center at 236 nm, and the band at 270 nm present in almost all HPHT treated stones; the H3 center at 503.5 nm which, in combination with the presence of the GR1 (General Radiation 1) at 741nm, is a strong indicator of irradiation in colored diamonds and at the same time can exclude the HPHT treatment as it is not capable of withstanding temperatures exceeding 800°C. Also important is the so-called pink band at 550 nm, responsible for natural color in fancy pink diamonds. Though detectable with certainty only by photoluminescence spectroscopy, the doublet at 736.6-736.9 nm caused by the silicon-vacancy defect (SiV-), characteristic and diagnostic of CVD synthetic diamond, can also be very often observed as a single absorption peak. We have already mentioned the GR1 at 741 nm but it is worth to add that it is the most common indicator of radiation (of natural and artificial origin) present in many type IIa diamonds. Due to its weak resistance to heat, it was considered for a long time diagnostic for the identification of non-HPHT type IIa treated diamonds. However, diligent and dishonest treaters have made sure to get around it: by submitting the HPHT treated stone to a light irradiation, in fact, the GR1 can be recreated. Moving towards the near infrared we meet the peak at 805.2 nm, typical of many synthetic diamonds and practically almost always absent in naturals. We close this brief and incomplete overview with the H2 center at 986 nm, very important in the analysis of the diamonds and the presence of which, in conjunction with the H3 center, is another indicator of HPHT treatment. There is a huge list of additional absorption bands that characterize the colorless and fancy colored diamonds: the UV-Vis-NIR spectroscopy is actually one of the most effective methods in their characterization. Last necessary mention, a very widespread effective technique in the study of diamond involves the use of special cryogenic setup with liquid nitrogen or helium. Cooling the samples to very low temperatures effectively allows the development of bands not visible in room temperature.
Colored stones
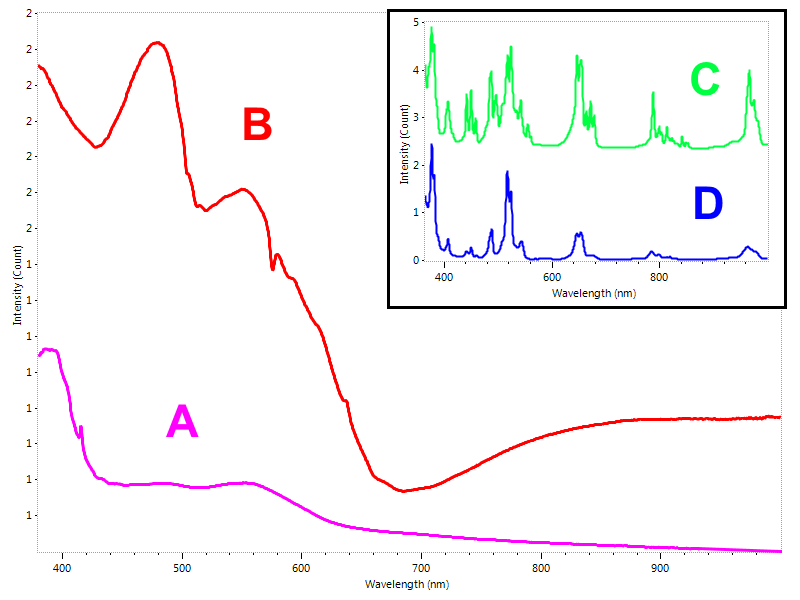
In many cases UV-Vis-NIR spectroscopy can be used for quick identification of colored stones. Surprisingly, even many visually colorless gems may possess a distinct absorption spectrum which helps to identify them; The effectiveness of this technique, just like the effectiveness of visual spectroscopy by using hand held spectroscope, is largely dependent on gemologist’s experience of typical absorption patterns and peaks of various gems and their imitations. Some commercial and few open source reference spectrum libraries are available, but usually computers are not very effective in finding a good match from a large data set of absorption spectra due to variable wideness of absorption bands. Most usually the absorption spectrum serves as fast confirmative technique once the researcher already has a good idea about the identity of the stone. In Fig. 4 an example of typical absorption spectrum of natural pink and artificially color enhanced pink diamond, together with pink Cubic Zirconia and pink YAG (yttrium aluminum garnet) used as pink diamond imitations.
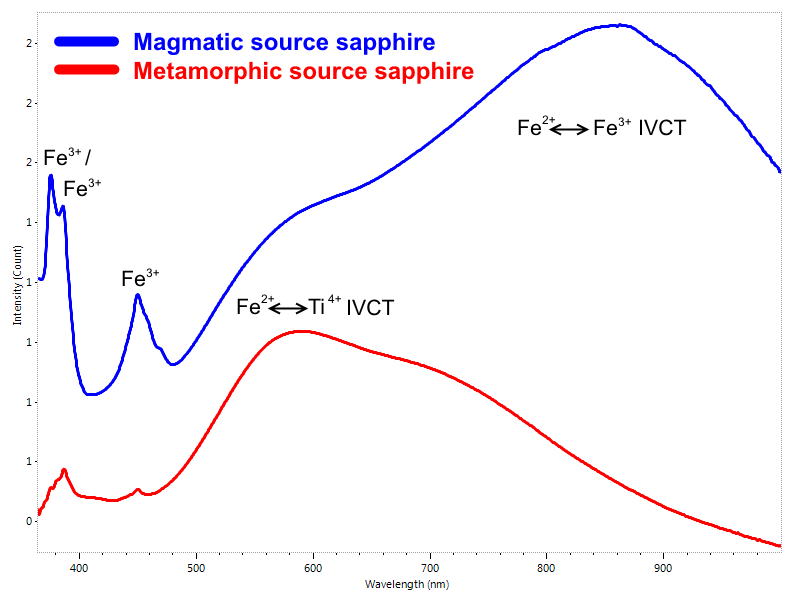
Besides the mere identification of gems by their typical spectra, UV-Vis-NIR technique provides a number of specific applications useful in gemology. Many of these applications does not produce a full picture about all the questions a gemologist may have in mind, but they still give valuable additional information which can be used towards composing the final conclusions. Determination of the geological origin of blue sapphires is an important step to help gemologists in the process of identifying possible heat treatment. Metamorphic and magmatic blue sapphires feature UV-Vis-NIR spectra whose absorption bands differ due to the presence of trace elements. More specifically, sapphires from metamorphic source display a dominant band caused by the intervalence charge transfer (IVCT) taking place between Fe2+ and Ti4+ and usually less evident absorptions due to Fe3+ (Fig. 5). On the other hand, magmatic origin sapphires feature a more distinct absorption bands due to Fe3+ and a distinctive band due to the intervalence charge transfer (IVCT) occurring between Fe2+ and Fe3+. Integrating this information with further inclusion microscopy and FTIR spectroscopy constitutes an important part of any lab protocol for sapphires.
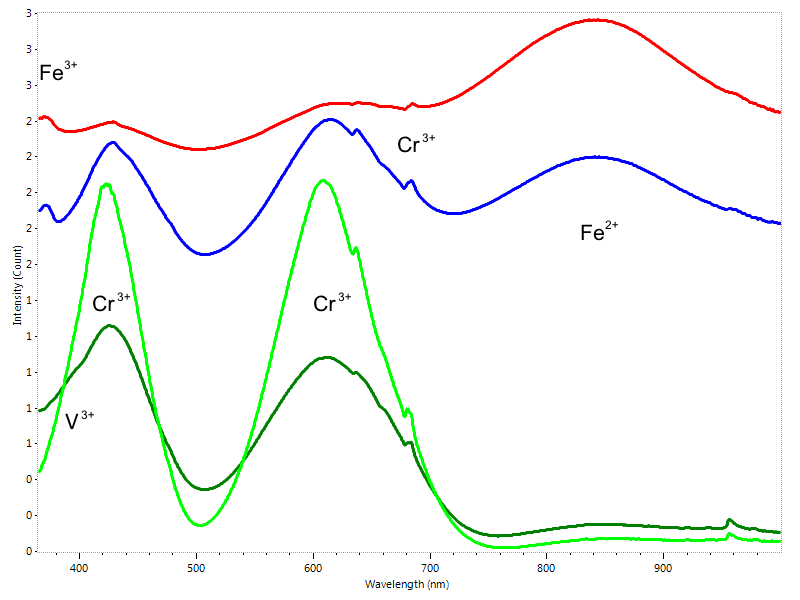
Even for Emeralds is important to have the possibility to scan the UV and NIR regions. Main bands in the visible area due to Cr3+ and V3+ won’t give really specific clues, but absorptions due to Fe2+ and Fe3+ , occurring, when present, respectively in the UV and NIR range, are extremely important for the identification of the geologic source (Fig. 6). While it’s extremely improbable for Colombian and Musakashi (Zambia) emeralds spectra to feature iron-related absorption bands, those can be observed at very different extent in spectra of stones sourced by other mines around the world.
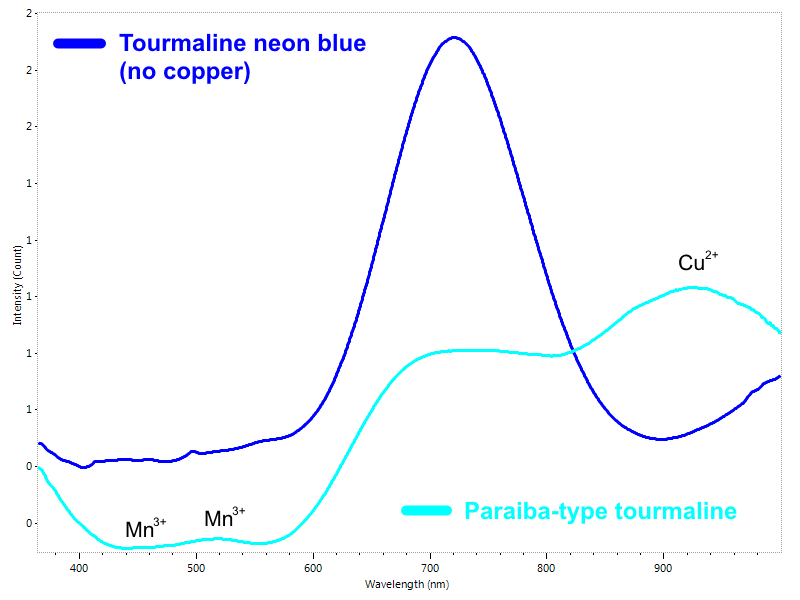
In last years the Paraiba tourmaline has reached a likely unprecedented importance in the gem market. It is a specific variety of copper bearing elbaite originally found in the Paraiba state of Brazil. There is plenty of beautiful blue tourmaline available, but only a very limited number of them can be labeled as “Paraiba” or “Paraiba-type” tourmaline. Its magnificent neon blue, bluish-green or greenish-blue color is strictly correlated to the presence of Copper and Manganese in the crystal lattice (Fig. 7). The ability to identify these trace elements is critical: a real Paraiba tourmaline can fetch in some cases hundreds times the value of an apparently identical non-copper bearing blue tourmaline.
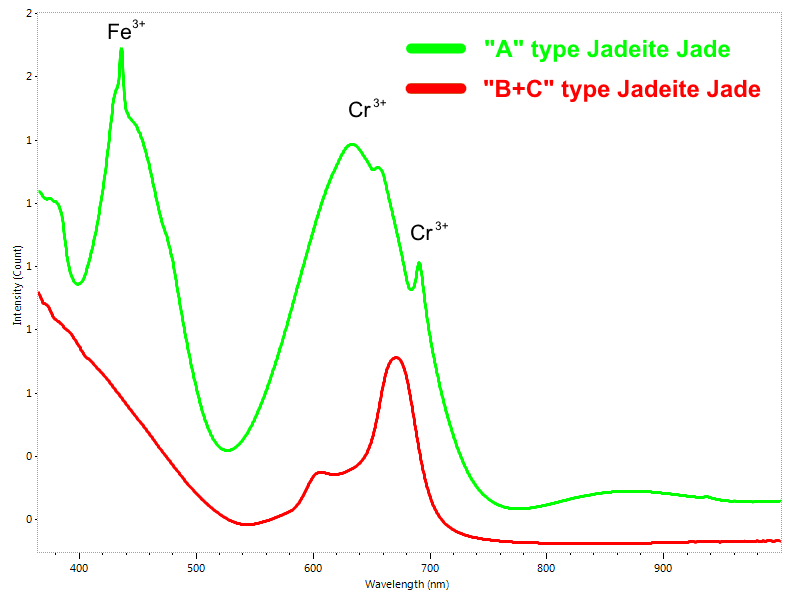
Jadeite is a gem which quality and value largely depends on its color. Low quality jadeite is commonly bleached, dyed and even impregnated with resins for improving its appearance. The best green natural jadeite (Type A-jadeite) is colored by chromium and usually also contains some amounts of iron, both identifiable by UV-Vis-NIR spectroscopy. Green dyes used for producing Type C-jadeite usually generates a distinct absorption spectrum which resembles the absorption spectrum of chromium but differs enough f to make the two distinguishable (Fig. 8). It is important to note that resins are not identified by UV-Vis-NIR spectroscopy, so additional tests by FTIR-spectroscopy and fluorescence microscopy are needed for testing resin impregnation (Type B – jadeite).
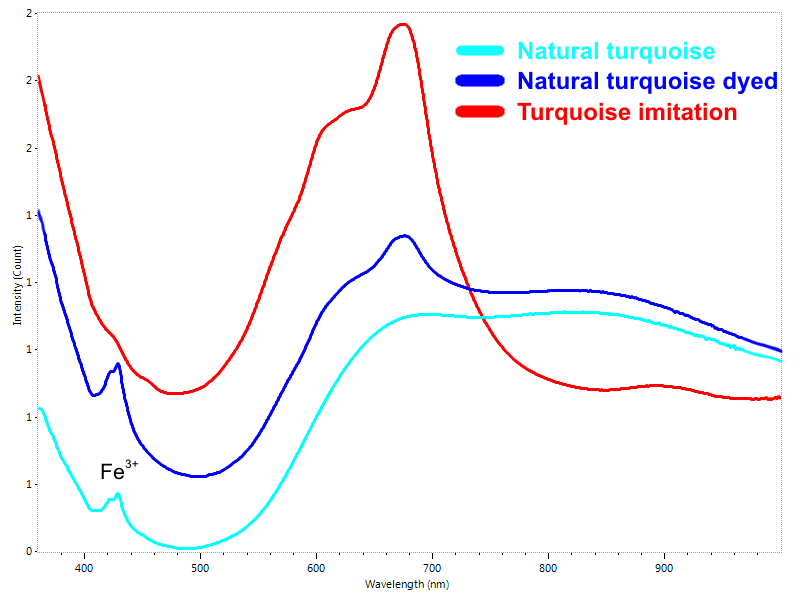
Another commonly dyed gem is turquoise. Turquoise is opaque material which means it has relatively strong absorption for all the visible light. However, with special sampling setup it is possible to acquire an informative reflection spectrum from the surface of turquoise. Natural blue color produced by copper gives a little bit different reflection spectrum compared to most common dyes. For example, the broad absorption bands centered approximately at 620 and 670 nm are common feature of dyed turquoise (Fig. 9).
These are just few examples to understand the importance of UV-Vis-NIR technique in gemology. There are many other applications that make this spectroscopy technique virtually irreplaceable in the modern gemological laboratory.
References
Anderson B., Payne J. (1998) – The spectroscope and gemology – London, UK, 269 pp.
Dobrinets I. A., Vins V. G., Zaitsev, A. M., (2013) – HPHT-Treated Diamonds – Berlin, Germany, 257 pp.
Han W., Lu T., Dai H., Su J., Dai H. – (2015) – Impregnated and dyed turquoise – Gems & Gemology, Vol. 51, No. 3.
Koivula J.I., Hughes R.W., (2006) – Gem Testing with the Spectroscope – www.lotusgemology.com
Saeseaw S., Pardieu V., Sangsawong S. (2014) – Three-phase inclusions in emerald and their impact on origin determination – Gems & Gemology, Vol. 50, No. 2
Smith C. P. (2009) – Inside emeralds – Rapaport Magazine, Vol. 32, No. 9
Smith C. P. (2010) – Inside Sapphires – Rapaport Magazine, Vol. 33, No. 7 Zaitsev A.M. (2001) – Optical Properties of Diamond Data Handbook – Germany, 486 pp.
Request your copy of Rivista Italiana di Gemmologia or buy a yearly subscription
Article by Alberto Scarani and Mikko Åström, published on Rivista Italiana di Gemmologia #1, May 2017.